# loading packages
library(DBI)
library(RPostgres)
library(tidyverse)Foreword
On November 18, 2022 I attended the SQL masterclass “SQL and PostgreSQL for Data Analytics”, presented live by Danny Ma on O’Reilly platform.
This Github repository contains all the necessary data, sql scripts, and other materials.
I’m posting some parts of it here for my own reference, but I strongly recommend that you register for that event that takes place every once in a while. It’s free and worth it. Danny Ma is an excellent teacher and his explanations are outstanding.
Setting up the programming environment
For the purposes of this project, I created the local trading Postgres database on my machine and ran the sql script to create and populate the tables.
The sql engine uses the DBI package to execute SQL queries, print their results, and optionally assign the results to a data frame. To use the sql engine, we first need to establish a DBI connection to a database (typically via the DBI::dbConnect() function).
Creating a connection to the trading database
mycon <- DBI::dbConnect(RPostgres::Postgres(),
                        dbname = "trading",
                        host = "localhost",
                        port = "5432",
                        user = rstudioapi::askForPassword("Database username"),
                        password = rstudioapi::askForPassword("Database password"))
There are several options to secure your credentials in R. Here I use prompting for credentials via rstudioapi.
mycon<PqConnection> trading@localhost:5432Introduction
In this fictitious case study - Danny’s data mentors from the Data With Danny team have been busy trading cryptocurrency markets since 2017.
The main purpose for this case study is to analyze the performance of the DWD mentors over time. We will accomplish this by writing SQL queries to utilize all available datasets to answer a series of realistic business questions.
Available Datasets
All of our data for this case study exists within the trading schema in the PostgreSQL database.
There are 3 data tables available in this schema:
memberspricestransactions
Entity Relationship Diagram
I drew the ERD here.
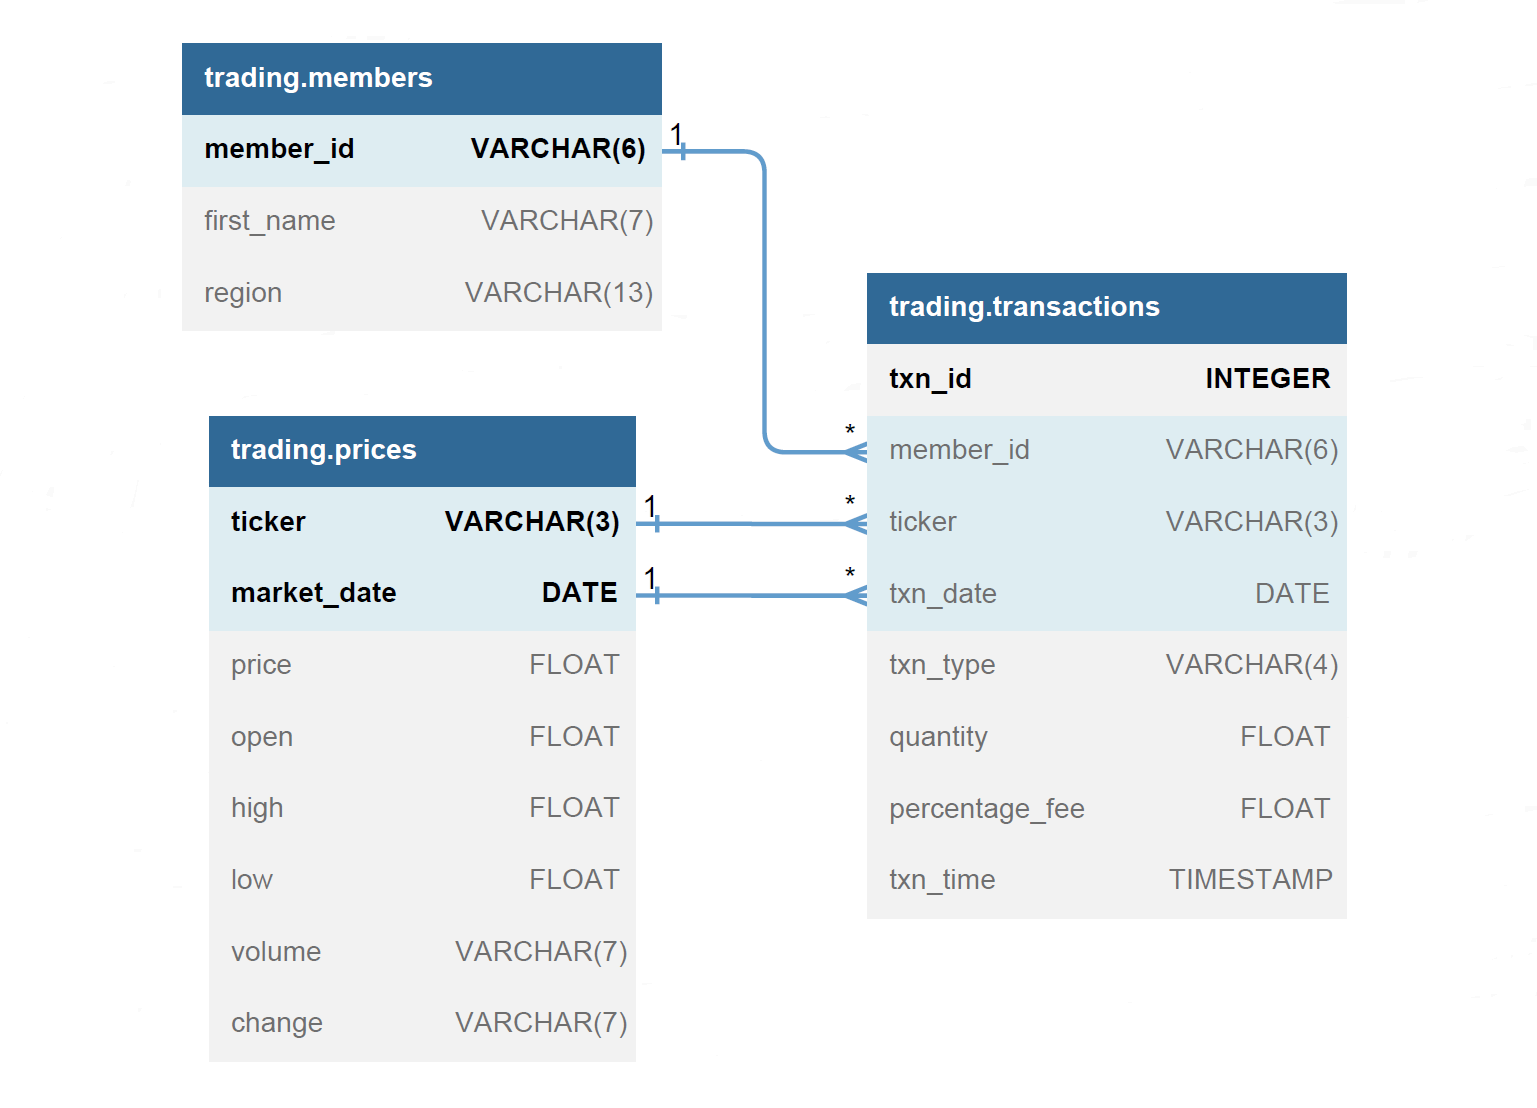
Data Dictionary and Overview
The trading.members table consists of information about the mentors from the Data With Danny team.
| Column name | Description |
|---|---|
member_id |
unique id for each mentor |
first_name |
first name for each mentor |
region |
region where each mentor is from |
SELECT * FROM trading.members| member_id | first_name | region |
|---|---|---|
| c4ca42 | Danny | Australia |
| c81e72 | Vipul | United States |
| eccbc8 | Charlie | United States |
| a87ff6 | Nandita | United States |
| e4da3b | Rowan | United States |
| 167909 | Ayush | United States |
| 8f14e4 | Alex | United States |
| c9f0f8 | Abe | United States |
| 45c48c | Ben | Australia |
| d3d944 | Enoch | Africa |
| 6512bd | Vikram | India |
| c20ad4 | Leah | Asia |
| c51ce4 | Pavan | Australia |
| aab323 | Sonia | Australia |
The trading.prices table consists of daily price and volume information from January 2017 through to August 2021 for the 2 most popular cryptocurrency tickers: Bitcoin and Ethereum.
| Column name | Description |
|---|---|
ticker |
one of either BTC or ETH |
market_date |
the date for each record |
price |
closing price at end of day |
open |
the opening price |
high |
the highest price for that day |
low |
the lowest price for that day |
volume |
the total volume traded |
change |
% change in daily price |
The first 5 rows from this dataset.
SELECT * FROM trading.prices LIMIT 5| ticker | market_date | price | open | high | low | volume | change |
|---|---|---|---|---|---|---|---|
| ETH | 2021-08-29 | 3177.84 | 3243.96 | 3282.21 | 3162.79 | 582.04K | -2.04% |
| ETH | 2021-08-28 | 3243.90 | 3273.78 | 3284.58 | 3212.24 | 466.21K | -0.91% |
| ETH | 2021-08-27 | 3273.58 | 3093.78 | 3279.93 | 3063.37 | 839.54K | 5.82% |
| ETH | 2021-08-26 | 3093.54 | 3228.03 | 3249.62 | 3057.48 | 118.44K | -4.17% |
| ETH | 2021-08-25 | 3228.15 | 3172.12 | 3247.43 | 3080.70 | 923.13K | 1.73% |
The trading.transactions table consists of buy and sell transactions data for each trade made by the DWD mentors.
| Column name | Description |
|---|---|
txn_id |
unique ID for each transaction |
member_id |
member identifier for each trade |
ticker |
the ticker for each trade |
txn_date |
the date for each transaction |
txn_type |
either BUY or SELL |
quantity |
the total quantity for each trade |
percentage_fee |
% of total amount charged as fees |
txn_time |
the timestamp for each trade |
The first 5 frows from this transactions table.
SELECT * FROM trading.transactions LIMIT 5| txn_id | member_id | ticker | txn_date | txn_type | quantity | percentage_fee | txn_time |
|---|---|---|---|---|---|---|---|
| 1 | c81e72 | BTC | 2017-01-01 | BUY | 50 | 0.3 | 2017-01-01 |
| 2 | eccbc8 | BTC | 2017-01-01 | BUY | 50 | 0.3 | 2017-01-01 |
| 3 | a87ff6 | BTC | 2017-01-01 | BUY | 50 | 0.0 | 2017-01-01 |
| 4 | e4da3b | BTC | 2017-01-01 | BUY | 50 | 0.3 | 2017-01-01 |
| 5 | 167909 | BTC | 2017-01-01 | BUY | 50 | 0.3 | 2017-01-01 |
PART 1️⃣: Basic Data Analysis Techniques
Question 1.1
Show only the top 5 rows from the trading.members table.
SELECT *
FROM trading.members
LIMIT 5| member_id | first_name | region |
|---|---|---|
| c4ca42 | Danny | Australia |
| c81e72 | Vipul | United States |
| eccbc8 | Charlie | United States |
| a87ff6 | Nandita | United States |
| e4da3b | Rowan | United States |
Question 1.2
Sort all the rows in the trading.members table by first_name in alphabetical order and show the top 3 rows with all columns.
SELECT *
FROM trading.members
ORDER BY first_name
LIMIT 3| member_id | first_name | region |
|---|---|---|
| c9f0f8 | Abe | United States |
| 8f14e4 | Alex | United States |
| 167909 | Ayush | United States |
Question 1.3
Count the number of records from the trading.members table which have United States as the region value.
SELECT
  COUNT(*) AS record_count
FROM trading.members
WHERE region = 'United States'| record_count |
|---|
| 7 |
Question 1.4
Select only the first_name and region columns for mentors who are not from Australia.
SELECT
  first_name,
  region
FROM trading.members
WHERE region != 'Australia'| first_name | region |
|---|---|
| Vipul | United States |
| Charlie | United States |
| Nandita | United States |
| Rowan | United States |
| Ayush | United States |
| Alex | United States |
| Abe | United States |
| Enoch | Africa |
| Vikram | India |
| Leah | Asia |
Question 1.5
Return only the unique region values from the trading.members table and sort the output by reverse alphabetical order.
SELECT DISTINCT region
FROM trading.members
ORDER BY region DESC| region |
|---|
| United States |
| India |
| Australia |
| Asia |
| Africa |
PART 2️⃣: Aggregate Functions for Data Analysis
Question 2.1
How many records are there per ticker value in the trading.prices table?
SELECT
  ticker,
  COUNT(*) AS record_count
FROM trading.prices
GROUP BY ticker| ticker | record_count |
|---|---|
| BTC | 1702 |
| ETH | 1702 |
Question 2.2
What is the maximum, minimum values for the price column for both Bitcoin and Ethereum in 2020?
SELECT
  ticker,
  MIN(price) AS min_price,
  MAX(price) AS max_price
FROM trading.prices
WHERE market_date BETWEEN '2020-01-01' AND '2020-12-31'
GROUP BY ticker| ticker | min_price | max_price |
|---|---|---|
| BTC | 4826.0 | 28949.4 |
| ETH | 107.9 | 751.8 |
Question 2.3
What is the annual minimum, maximum and average price for each ticker?
- Include a calendar_year column with the year from 2017 through to 2021
- Calculate a
spreadcolumn which calculates the difference between the min and max prices - Round the average price output to 2 decimal places
- Sort the output in chronological order with Bitcoin records before Ethereum within each year
SELECT
  EXTRACT(YEAR FROM market_date) AS calendar_year,
  ticker,
  MIN(price) AS min_price,
  MAX(price) AS max_price,
  ROUND(AVG(price)::NUMERIC, 2) AS avg_price,
  MAX(price) - MIN(price) AS spread
FROM trading.prices
GROUP BY calendar_year, ticker
ORDER BY calendar_year, ticker| calendar_year | ticker | min_price | max_price | avg_price | spread |
|---|---|---|---|---|---|
| 2017 | BTC | 785.40 | 19345.50 | 3981.07 | 18560.10 |
| 2017 | ETH | 8.20 | 799.98 | 220.34 | 791.78 |
| 2018 | BTC | 3228.70 | 17172.30 | 7552.16 | 13943.60 |
| 2018 | ETH | 83.81 | 1380.00 | 481.33 | 1296.19 |
| 2019 | BTC | 3397.70 | 13063.80 | 7371.82 | 9666.10 |
| 2019 | ETH | 104.55 | 338.54 | 180.99 | 233.99 |
| 2020 | BTC | 4826.00 | 28949.40 | 11111.63 | 24123.40 |
| 2020 | ETH | 107.90 | 751.80 | 307.30 | 643.90 |
| 2021 | BTC | 29359.90 | 63540.90 | 44353.55 | 34181.00 |
| 2021 | ETH | 729.12 | 4167.78 | 2199.12 | 3438.66 |
Question 2.4
What is the monthly average of the price column for each ticker from January 2020 and after?
- Create a
month_startcolumn with the first day of each month - Sort the output by ticker in alphabetical order and months in chronological order
- Round the
average_pricecolumn to 2 decimal places
SELECT
  ticker,
  DATE_TRUNC('MON', market_date)::DATE AS month_start,
  ROUND(AVG(price)::NUMERIC, 2) AS average_price
FROM trading.prices
WHERE market_date >= '2020-01-01'
GROUP BY ticker, month_start
ORDER BY ticker, month_start| ticker | month_start | average_price |
|---|---|---|
| BTC | 2020-01-01 | 8378.80 |
| BTC | 2020-02-01 | 9636.56 |
| BTC | 2020-03-01 | 6863.11 |
| BTC | 2020-04-01 | 7211.03 |
| BTC | 2020-05-01 | 9253.55 |
| BTC | 2020-06-01 | 9481.85 |
| BTC | 2020-07-01 | 9592.10 |
| BTC | 2020-08-01 | 11638.41 |
| BTC | 2020-09-01 | 10643.33 |
| BTC | 2020-10-01 | 11888.36 |
PART 3️⃣: Case When Statements
Question 3.1
Convert the volume column in the trading.prices table with an adjusted integer value to take into the unit values
- Return only the
market_date,price,volumeandadjusted_volumecolumns for the first 10 days of August 2021 for Ethereum only
SELECT
  market_date,
  price,
  volume,
  CASE
    WHEN RIGHT(volume, 1) = 'K' THEN LEFT(volume, LENGTH(volume) - 1)::NUMERIC * 1000
    WHEN RIGHT(volume, 1) = 'M' THEN LEFT(volume, LENGTH(volume) - 1)::NUMERIC * 1000000
    WHEN volume = '-' THEN 0
    END AS adjusted_volume
FROM trading.prices
WHERE ticker = 'ETH'
  AND market_date BETWEEN '2021-08-01' AND '2021-08-10'
ORDER BY market_date| market_date | price | volume | adjusted_volume |
|---|---|---|---|
| 2021-08-01 | 2556.23 | 1.20M | 1200000 |
| 2021-08-02 | 2608.04 | 970.67K | 970670 |
| 2021-08-03 | 2506.65 | 158.45K | 158450 |
| 2021-08-04 | 2725.29 | 1.23M | 1230000 |
| 2021-08-05 | 2827.21 | 1.65M | 1650000 |
| 2021-08-06 | 2889.43 | 1.06M | 1060000 |
| 2021-08-07 | 3158.00 | 64.84K | 64840 |
| 2021-08-08 | 3012.07 | 1.25M | 1250000 |
| 2021-08-09 | 3162.93 | 1.44M | 1440000 |
| 2021-08-10 | 3140.71 | 1.12M | 1120000 |
Question 3.2
How many “breakout” days were there in 2020 where the price column is greater than the open column for each ticker? In the same query also calculate the number of “non breakout” days where the price column was lower than or equal to the open column.
SELECT
  ticker,
  SUM(CASE WHEN price > open THEN 1 ELSE 0 END) AS breakout_days,
  SUM(CASE WHEN price <= open THEN 1 ELSE 0 END) AS non_breakout_days
FROM trading.prices
WHERE market_date BETWEEN '2020-01-01' AND '2020-12-31'
GROUP BY ticker| ticker | breakout_days | non_breakout_days |
|---|---|---|
| BTC | 207 | 159 |
| ETH | 200 | 166 |
Question 3.3
What was the final quantity Bitcoin and Ethereum held by all Data With Danny mentors based off the trading.transactions table?
SELECT
  ticker,
  SUM(CASE WHEN txn_type = 'SELL' THEN -quantity ELSE quantity END) AS final_btc_holding
FROM trading.transactions
GROUP BY ticker| ticker | final_btc_holding |
|---|---|
| BTC | 42848.67 |
| ETH | 32801.04 |
Divided by quantity bought and quantity sold.
SELECT
  ticker,
  SUM(CASE WHEN txn_type = 'BUY' THEN quantity ELSE 0 END) AS qty_bought,
  SUM(CASE WHEN txn_type = 'SELL' THEN quantity ELSE 0 END) AS qty_sold
FROM trading.transactions
GROUP BY ticker| ticker | qty_bought | qty_sold |
|---|---|---|
| BTC | 53250.15 | 10401.485 |
| ETH | 42599.20 | 9798.154 |
PART 4️⃣: Window Functions
Question 4.1
What are the market_date, price and volume and price_rank values for the days with the top 5 highest price values for each tickers in the trading.prices table?
- The
price_rankcolumn is the ranking for price values for each ticker with rank = 1 for the highest value. - Return the output for Bitcoin, followed by Ethereum in price rank order.
WITH cte_rank AS (
  SELECT
    ticker,
    market_date,
    price,
    volume,
    RANK() OVER (PARTITION BY ticker ORDER BY price DESC) AS price_rank
  FROM trading.prices
)

SELECT *
FROM cte_rank
WHERE price_rank <= 5
ORDER BY ticker, price_rank| ticker | market_date | price | volume | price_rank |
|---|---|---|---|---|
| BTC | 2021-04-13 | 63540.90 | 126.56K | 1 |
| BTC | 2021-04-15 | 63216.00 | 76.97K | 2 |
| BTC | 2021-04-14 | 62980.40 | 130.43K | 3 |
| BTC | 2021-04-16 | 61379.70 | 136.85K | 4 |
| BTC | 2021-03-13 | 61195.30 | 134.64K | 5 |
| ETH | 2021-05-11 | 4167.78 | 1.27M | 1 |
| ETH | 2021-05-14 | 4075.38 | 2.06M | 2 |
| ETH | 2021-05-10 | 3947.90 | 2.70M | 3 |
| ETH | 2021-05-09 | 3922.23 | 1.94M | 4 |
| ETH | 2021-05-08 | 3905.55 | 1.34M | 5 |
Question 4.1 - solution
members <- read_csv("data/members_tbl.csv")
prices <- read_csv("data/prices_tbl.csv")
transactions <- read_csv("data/transactions_tbl.csv")

prices %>% head()
# A tibble: 6 × 8
ticker market_date price open high low volume change
<chr> <date> <dbl> <dbl> <dbl> <dbl> <chr> <chr>
1 ETH 2021-08-29 3178. 3244. 3282. 3163. 582.04K -2.04%
2 ETH 2021-08-28 3244. 3274. 3285. 3212. 466.21K -0.91%
3 ETH 2021-08-27 3274. 3094. 3280. 3063. 839.54K 5.82%
4 ETH 2021-08-26 3094. 3228. 3250. 3057. 118.44K -4.17%
5 ETH 2021-08-25 3228. 3172. 3247. 3081. 923.13K 1.73%
6 ETH 2021-08-24 3173. 3323. 3358. 3151. 988.82K -4.41%# R solution
prices %>%
select(ticker, market_date, price, volume) %>%
group_by(ticker) %>%
arrange(ticker, desc(price)) %>%
mutate(price_rank = row_number()) %>%
filter(price_rank <=5)# A tibble: 10 × 5
# Groups: ticker [2]
ticker market_date price volume price_rank
<chr> <date> <dbl> <chr> <int>
1 BTC 2021-04-13 63541. 126.56K 1
2 BTC 2021-04-15 63216 76.97K 2
3 BTC 2021-04-14 62980. 130.43K 3
4 BTC 2021-04-16 61380. 136.85K 4
5 BTC 2021-03-13 61195. 134.64K 5
6 ETH 2021-05-11 4168. 1.27M 1
7 ETH 2021-05-14 4075. 2.06M 2
8 ETH 2021-05-10 3948. 2.70M 3
9 ETH 2021-05-09 3922. 1.94M 4
10 ETH 2021-05-08 3906. 1.34M 5Question 4.2
Calculate a 7 day rolling average for the price and volume columns in the trading.prices table for each ticker.
- Return only the first 10 days of August 2021
-- Step 1 - Adjusted prices CTE
WITH cte_adjusted_prices AS (
  SELECT
    ticker,
    market_date,
    price,
    CASE
      WHEN RIGHT(volume, 1) = 'K' THEN LEFT(volume, LENGTH(volume)-1)::NUMERIC * 1000
      WHEN RIGHT(volume, 1) = 'M' THEN LEFT(volume, LENGTH(volume)-1)::NUMERIC * 1000000
      WHEN volume = '-' THEN 0
    END AS volume
  FROM trading.prices
),

-- Step 2 - Moving Averages CTE
cte_moving_averages AS (
  SELECT
    ticker,
    market_date,
    price,
    AVG(price) OVER (
      PARTITION BY ticker
      ORDER BY market_date
      RANGE BETWEEN '6 DAYS' PRECEDING AND CURRENT ROW
    ) AS moving_avg_price,
    volume,
    AVG(volume) OVER (
      PARTITION BY ticker
      ORDER BY market_date
      RANGE BETWEEN '6 DAYS' PRECEDING AND CURRENT ROW
    ) AS moving_avg_volume
  FROM cte_adjusted_prices
)

-- final output
SELECT * FROM cte_moving_averages
WHERE market_date BETWEEN '2021-08-01' AND '2021-08-10'
ORDER BY ticker, market_date;| ticker | market_date | price | moving_avg_price | volume | moving_avg_volume |
|---|---|---|---|---|---|
| BTC | 2021-08-01 | 39878.30 | 40052.657 | 80330 | 103645.71 |
| BTC | 2021-08-02 | 39168.40 | 40322.914 | 74810 | 88957.14 |
| BTC | 2021-08-03 | 38130.30 | 40134.100 | 260 | 74674.29 |
| BTC | 2021-08-04 | 39736.90 | 40096.057 | 79220 | 64717.14 |
| BTC | 2021-08-05 | 40867.20 | 40219.743 | 130600 | 72617.14 |
| BTC | 2021-08-06 | 42795.40 | 40304.314 | 111930 | 74542.86 |
| BTC | 2021-08-07 | 44614.20 | 40741.529 | 112840 | 84284.29 |
| BTC | 2021-08-08 | 43792.80 | 41300.743 | 105250 | 87844.29 |
| BTC | 2021-08-09 | 46284.30 | 42317.300 | 117080 | 93882.86 |
| BTC | 2021-08-10 | 45593.80 | 43383.514 | 80550 | 105352.86 |
| ETH | 2021-08-01 | 2556.23 | 2394.166 | 1200000 | 1069824.29 |
| ETH | 2021-08-02 | 2608.04 | 2448.239 | 970670 | 938491.43 |
| ETH | 2021-08-03 | 2506.65 | 2477.729 | 158450 | 782555.71 |
| ETH | 2021-08-04 | 2725.29 | 2538.611 | 1230000 | 819850.00 |
| ETH | 2021-08-05 | 2827.21 | 2602.366 | 1650000 | 963742.86 |
| ETH | 2021-08-06 | 2889.43 | 2663.577 | 1060000 | 968028.57 |
| ETH | 2021-08-07 | 3158.00 | 2752.979 | 64840 | 904851.43 |
| ETH | 2021-08-08 | 3012.07 | 2818.099 | 1250000 | 911994.29 |
| ETH | 2021-08-09 | 3162.93 | 2897.369 | 1440000 | 979041.43 |
| ETH | 2021-08-10 | 3140.71 | 2987.949 | 1120000 | 1116405.71 |
Question 4.2 - solution
prices %>%
  mutate(volume = case_when(
    str_sub(volume, -1) == "K" ~ as.numeric(str_sub(volume, 1, str_length(volume) - 1)) * 10^3,
    str_sub(volume, -1) == "M" ~ as.numeric(str_sub(volume, 1, str_length(volume) - 1)) * 10^6,
    str_sub(volume, -1) == "-" ~ as.numeric(str_sub(volume, 1, str_length(volume) - 1)) * 0)
  ) %>%
  group_by(ticker) %>%
  arrange(ticker, market_date) %>%
  mutate(moving_avg_price = zoo::rollmean(price, k = 7, align = "right", fill = NA),
         moving_avg_volume = zoo::rollmean(volume, k = 7, align = "right", fill = NA)) %>%
  select(ticker, market_date, price, moving_avg_price, volume, moving_avg_volume) %>%
  filter(market_date >= "2021-08-01", market_date <= "2021-08-10")
# A tibble: 20 × 6
# Groups: ticker [2]
ticker market_date price moving_avg_price volume moving_avg_volume
<chr> <date> <dbl> <dbl> <dbl> <dbl>
1 BTC 2021-08-01 39878. 40053. 80330 103646.
2 BTC 2021-08-02 39168. 40323. 74810 88957.
3 BTC 2021-08-03 38130. 40134. 260 74674.
4 BTC 2021-08-04 39737. 40096. 79220 64717.
5 BTC 2021-08-05 40867. 40220. 130600 72617.
6 BTC 2021-08-06 42795. 40304. 111930 74543.
7 BTC 2021-08-07 44614. 40742. 112840 84284.
8 BTC 2021-08-08 43793. 41301. 105250 87844.
9 BTC 2021-08-09 46284. 42317. 117080 93883.
10 BTC 2021-08-10 45594. 43384. 80550 105353.
11 ETH 2021-08-01 2556. 2394. 1200000 1069824.
12 ETH 2021-08-02 2608. 2448. 970670 938491.
13 ETH 2021-08-03 2507. 2478. 158450 782556.
14 ETH 2021-08-04 2725. 2539. 1230000 819850
15 ETH 2021-08-05 2827. 2602. 1650000 963743.
16 ETH 2021-08-06 2889. 2664. 1060000 968029.
17 ETH 2021-08-07 3158 2753. 64840 904851.
18 ETH 2021-08-08 3012. 2818. 1250000 911994.
19 ETH 2021-08-09 3163. 2897. 1440000 979041.
20 ETH 2021-08-10 3141. 2988. 1120000 1116406.Question 4.3
Calculate the monthly cumulative volume traded for each ticker in 2020
- Sort the output by ticker in chronological order with the
month_startas the first day of each month
WITH cte_monthly_volume AS (
  SELECT
    ticker,
    DATE_TRUNC('MON', market_date)::DATE AS month_start,
    SUM(
      CASE
      WHEN RIGHT(volume, 1) = 'K' THEN LEFT(volume, LENGTH(volume)-1)::NUMERIC * 1000
      WHEN RIGHT(volume, 1) = 'M' THEN LEFT(volume, LENGTH(volume)-1)::NUMERIC * 1000000
      WHEN volume = '-' THEN 0
    END
  ) AS monthly_volume
  FROM trading.prices
  WHERE market_date BETWEEN '2020-01-01' AND '2020-12-31'
  GROUP BY ticker, month_start
)

SELECT
  ticker,
  month_start,
  SUM(monthly_volume) OVER (
    PARTITION BY ticker
    ORDER BY month_start
    ROWS BETWEEN UNBOUNDED PRECEDING AND CURRENT ROW
  ) AS cumulative_monthly_volume
FROM cte_monthly_volume
ORDER BY ticker, month_start| ticker | month_start | cumulative_monthly_volume |
|---|---|---|
| BTC | 2020-01-01 | 23451920 |
| BTC | 2020-02-01 | 46839130 |
| BTC | 2020-03-01 | 94680450 |
| BTC | 2020-04-01 | 134302740 |
| BTC | 2020-05-01 | 172687010 |
| BTC | 2020-06-01 | 188026610 |
| BTC | 2020-07-01 | 201272600 |
| BTC | 2020-08-01 | 216762630 |
| BTC | 2020-09-01 | 300641440 |
| BTC | 2020-10-01 | 303060020 |
Question 4.3 - solution
prices %>%
  select(ticker, market_date, volume) %>%
  filter(market_date >= "2020-01-01", market_date <= "2020-12-31") %>%
  mutate(month_start = lubridate::floor_date(market_date, unit = "month")) %>%
  group_by(ticker, month_start) %>%
  summarise(monthly_volume = sum(
    case_when(
      str_sub(volume, -1) == "K" ~ as.numeric(str_sub(volume, 1, str_length(volume) - 1)) * 10^3,
      str_sub(volume, -1) == "M" ~ as.numeric(str_sub(volume, 1, str_length(volume) - 1)) * 10^6,
      str_sub(volume, -1) == "-" ~ as.numeric(str_sub(volume, 1, str_length(volume) - 1)) * 0)
    )
  ) %>%
  ungroup() %>%
  group_by(ticker) %>%
  mutate(cumulative_monthly_volume = cumsum(monthly_volume)) %>%
  ungroup()
# A tibble: 24 × 4
ticker month_start monthly_volume cumulative_monthly_volume
<chr> <date> <dbl> <dbl>
1 BTC 2020-01-01 23451920 23451920
2 BTC 2020-02-01 23387210 46839130
3 BTC 2020-03-01 47841320 94680450
4 BTC 2020-04-01 39622290 134302740
5 BTC 2020-05-01 38384270 172687010
6 BTC 2020-06-01 15339600 188026610
7 BTC 2020-07-01 13245990 201272600
8 BTC 2020-08-01 15490030 216762630
9 BTC 2020-09-01 83878810 300641440
10 BTC 2020-10-01 2418580 303060020
# … with 14 more rowsQuestion 4.4
Calculate the daily percentage change in volume for each ticker in the trading.prices table
- Percentage change can be calculated as (current - previous) / previous
- Multiply the percentage by 100 and round the value to 2 decimal places
- Return data for the first 10 days of August 2021
WITH cte_adjusted_prices AS (
  SELECT
    ticker,
    market_date,
    CASE
      WHEN RIGHT(volume, 1) = 'K' THEN LEFT(volume, LENGTH(volume)-1)::NUMERIC * 1000
      WHEN RIGHT(volume, 1) = 'M' THEN LEFT(volume, LENGTH(volume)-1)::NUMERIC * 1000000
      WHEN volume = '-' THEN 0
    END AS volume
  FROM trading.prices
),

cte_previous_volume AS (
  SELECT
    ticker,
    market_date,
    volume,
    LAG(volume) OVER (PARTITION BY ticker ORDER BY market_date) AS previous_volume
  FROM cte_adjusted_prices
  WHERE volume != 0
)

SELECT
  ticker,
  market_date,
  volume,
  previous_volume,
  ROUND(100 * (volume - previous_volume) / previous_volume, 2) AS daily_change
FROM cte_previous_volume
WHERE market_date BETWEEN '2021-08-01' AND '2021-08-10'
ORDER BY ticker, market_date| ticker | market_date | volume | previous_volume | daily_change |
|---|---|---|---|---|
| BTC | 2021-08-01 | 80330 | 44650 | 79.91 |
| BTC | 2021-08-02 | 74810 | 80330 | -6.87 |
| BTC | 2021-08-03 | 260 | 74810 | -99.65 |
| BTC | 2021-08-04 | 79220 | 260 | 30369.23 |
| BTC | 2021-08-05 | 130600 | 79220 | 64.86 |
| BTC | 2021-08-06 | 111930 | 130600 | -14.30 |
| BTC | 2021-08-07 | 112840 | 111930 | 0.81 |
| BTC | 2021-08-08 | 105250 | 112840 | -6.73 |
| BTC | 2021-08-09 | 117080 | 105250 | 11.24 |
| BTC | 2021-08-10 | 80550 | 117080 | -31.20 |
| ETH | 2021-08-01 | 1200000 | 507080 | 136.65 |
| ETH | 2021-08-02 | 970670 | 1200000 | -19.11 |
| ETH | 2021-08-03 | 158450 | 970670 | -83.68 |
| ETH | 2021-08-04 | 1230000 | 158450 | 676.27 |
| ETH | 2021-08-05 | 1650000 | 1230000 | 34.15 |
| ETH | 2021-08-06 | 1060000 | 1650000 | -35.76 |
| ETH | 2021-08-07 | 64840 | 1060000 | -93.88 |
| ETH | 2021-08-08 | 1250000 | 64840 | 1827.82 |
| ETH | 2021-08-09 | 1440000 | 1250000 | 15.20 |
| ETH | 2021-08-10 | 1120000 | 1440000 | -22.22 |
Question 4.4 - solution
prices %>%
  select(ticker, market_date, volume) %>%
  mutate(volume = case_when(
    str_sub(volume, -1) == "K" ~ as.numeric(str_sub(volume, 1, str_length(volume) - 1)) * 10^3,
    str_sub(volume, -1) == "M" ~ as.numeric(str_sub(volume, 1, str_length(volume) - 1)) * 10^6,
    str_sub(volume, -1) == "-" ~ as.numeric(str_sub(volume, 1, str_length(volume) - 1)) * 0)
  ) %>%
  arrange(ticker, market_date) %>%
  mutate(volume_prev_day = lag(volume)) %>%
  mutate(daily_change_perc = round(100*(volume - volume_prev_day)/volume_prev_day, 2)) %>%
  filter(market_date >= "2021-08-01", market_date <= "2021-08-10")
# A tibble: 20 × 5
ticker market_date volume volume_prev_day daily_change_perc
<chr> <date> <dbl> <dbl> <dbl>
1 BTC 2021-08-01 80330 44650 79.9
2 BTC 2021-08-02 74810 80330 -6.87
3 BTC 2021-08-03 260 74810 -99.6
4 BTC 2021-08-04 79220 260 30369.
5 BTC 2021-08-05 130600 79220 64.9
6 BTC 2021-08-06 111930 130600 -14.3
7 BTC 2021-08-07 112840 111930 0.81
8 BTC 2021-08-08 105250 112840 -6.73
9 BTC 2021-08-09 117080 105250 11.2
10 BTC 2021-08-10 80550 117080 -31.2
11 ETH 2021-08-01 1200000 507080 137.
12 ETH 2021-08-02 970670 1200000 -19.1
13 ETH 2021-08-03 158450 970670 -83.7
14 ETH 2021-08-04 1230000 158450 676.
15 ETH 2021-08-05 1650000 1230000 34.2
16 ETH 2021-08-06 1060000 1650000 -35.8
17 ETH 2021-08-07 64840 1060000 -93.9
18 ETH 2021-08-08 1250000 64840 1828.
19 ETH 2021-08-09 1440000 1250000 15.2
20 ETH 2021-08-10 1120000 1440000 -22.2 PART 5️⃣: Table Joins
Question 5.1 - Inner Joins
Which top 3 mentors have the most Bitcoin quantity? Return the first_name of the mentors and sort the output from highest to lowest total_quantity.
SELECT
  m.first_name,
  SUM(
    CASE
      WHEN t.txn_type = 'BUY' THEN t.quantity
      WHEN t.txn_type = 'SELL' THEN -t.quantity
      END
  ) AS total_quantity
FROM trading.transactions t
INNER JOIN trading.members m
  ON t.member_id = m.member_id
WHERE ticker = 'BTC'
GROUP By m.first_name
ORDER BY total_quantity DESC
LIMIT 3| first_name | total_quantity |
|---|---|
| Nandita | 4160.220 |
| Leah | 4046.091 |
| Ayush | 3945.198 |
Question 5.2 - Left Joins
Show the market_date values which have less than 5 transactions? Sort the output in reverse chronological order.
SELECT
  p.market_date,
  COUNT(t.txn_id) AS transaction_count
FROM trading.prices p
LEFT JOIN trading.transactions t
  ON p.market_date = t.txn_date
  AND p.ticker = t.ticker
GROUP BY p.market_date
HAVING COUNT(t.txn_id) < 5
ORDER BY p.market_date DESC| market_date | transaction_count |
|---|---|
| 2021-08-29 | 0 |
| 2021-08-28 | 0 |
| 2021-07-17 | 3 |
| 2021-01-06 | 4 |
| 2020-01-17 | 4 |
| 2019-07-15 | 4 |
| 2019-06-14 | 3 |
| 2018-10-20 | 4 |
Question 5.3 - Multiple Table Joins
Part 1: Calculate the Dollar Cost Average
What is the dollar cost average (btc_dca) for all Bitcoin purchases by region for each calendar year?
- Create a column called
year_startand use the start of the calendar year - The dollar cost average calculation is
btc_dca= SUM(quantity xprice) / SUM(quantity)
Part 2: Yearly Dollar Cost Average Ranking
Use this btc_dca value to generate a dca_ranking column for each year
- The region with the lowest
btc_dcaeach year has a rank of 1
Part 3: Dollar Cost Average Yearly Percentage Change
Calculate the yearly percentage change in DCA for each region to 2 decimal places
- This calculation is (current - previous) / previous
Finally order the output by region and year_start columns.
WITH cte_dollar_cost_average AS (
  SELECT
    DATE_TRUNC('YEAR', transactions.txn_date)::DATE AS year_start,
    members.region,
    SUM(transactions.quantity * prices.price) / SUM(transactions.quantity) AS btc_dca
  FROM trading.transactions
  INNER JOIN trading.prices
    ON transactions.ticker = prices.ticker
    AND transactions.txn_date = prices.market_date
  INNER JOIN trading.members
    ON transactions.member_id = members.member_id
  WHERE transactions.ticker = 'BTC'
    AND transactions.txn_type = 'BUY'
  GROUP BY year_start, members.region
),

cte_window_functions AS (
  SELECT
    year_start,
    region,
    btc_dca,
    RANK() OVER (PARTITION BY year_start ORDER BY btc_dca) AS dca_ranking,
    LAG(btc_dca) OVER (PARTITION BY region ORDER BY year_start) AS previous_btc_dca
  FROM cte_dollar_cost_average
)

SELECT
  year_start,
  region,
  btc_dca,
  dca_ranking,
  ROUND(
    (100 * (btc_dca - previous_btc_dca) / previous_btc_dca)::NUMERIC,
    2
  ) AS dca_percentage_change
FROM cte_window_functions
ORDER BY region, year_start| year_start | region | btc_dca | dca_ranking | dca_percentage_change |
|---|---|---|---|---|
| 2017-01-01 | Africa | 3987.626 | 4 | NA |
| 2018-01-01 | Africa | 7690.713 | 3 | 92.86 |
| 2019-01-01 | Africa | 7368.820 | 4 | -4.19 |
| 2020-01-01 | Africa | 11114.125 | 3 | 50.83 |
| 2021-01-01 | Africa | 44247.215 | 2 | 298.12 |
| 2017-01-01 | Asia | 4002.939 | 5 | NA |
| 2018-01-01 | Asia | 7829.999 | 4 | 95.61 |
| 2019-01-01 | Asia | 7267.679 | 1 | -7.18 |
| 2020-01-01 | Asia | 10759.621 | 2 | 48.05 |
| 2021-01-01 | Asia | 44570.901 | 4 | 314.24 |
Thanks for reading!