# loading packages
library(tidyverse)
library(rvest)Introduction
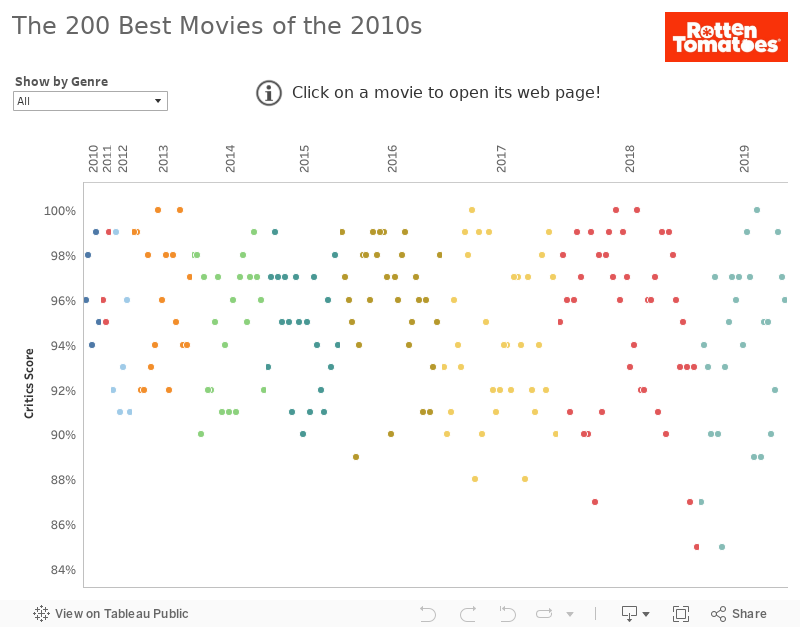
The goal of this project is to scrape data on the 200 best movies of the last decade from the Rotten Tomatoes website with the R rvest package, and finally create a dashboard in Tableau. The idea is to show all the movies in one place. Hovering over the movie should reveal relevant data in the tooltip for quick overview. Clicking on the movie should open the movie’s website for more information.
I’ve learned so much while working on this project (like web scraping, writing functions, iteration, …). The purrr package for functional programming is super-cool. It allows iteration with just one line of code (a very handy replacement for for loops).
I hope you’ll enjoy the process as much as I did. At times it was quite challenging, but that’s how we learn!
Setting up the programming environment
Are we allowed to scrape data from the Rotten Tomatoes website?
robotstxt::paths_allowed("https://www.rottentomatoes.com/")[1] TRUEPlan
The data will be scraped from this page. Since it doesn’t contain all the data I am interested in, I have to visit every movie’s web page on the list and scrape data from there. Here is the plan:
Scrape data from the main page: the
urls of movies, and theurls of images.Scrape
title,year_genre_runtime,critics_score,audiaece_score, andsynopsisfrom the first movie to develop the code.Write a function that scrapes data based on movie’s URL.
Iteration - use this function to scrape data from each individual movie and create a data frame with the columns
title,year_genre_runtime,critics_score,audiaece_score,synopsis, andurl.Download images
Prepare data for Tableau
Create a dashboard in Tableau
1. Scraping data from the main page
Reading the main page with read_html().
main_url <- "https://editorial.rottentomatoes.com/guide/the-200-best-movies-of-the-2010s/"
main_page <- read_html(main_url)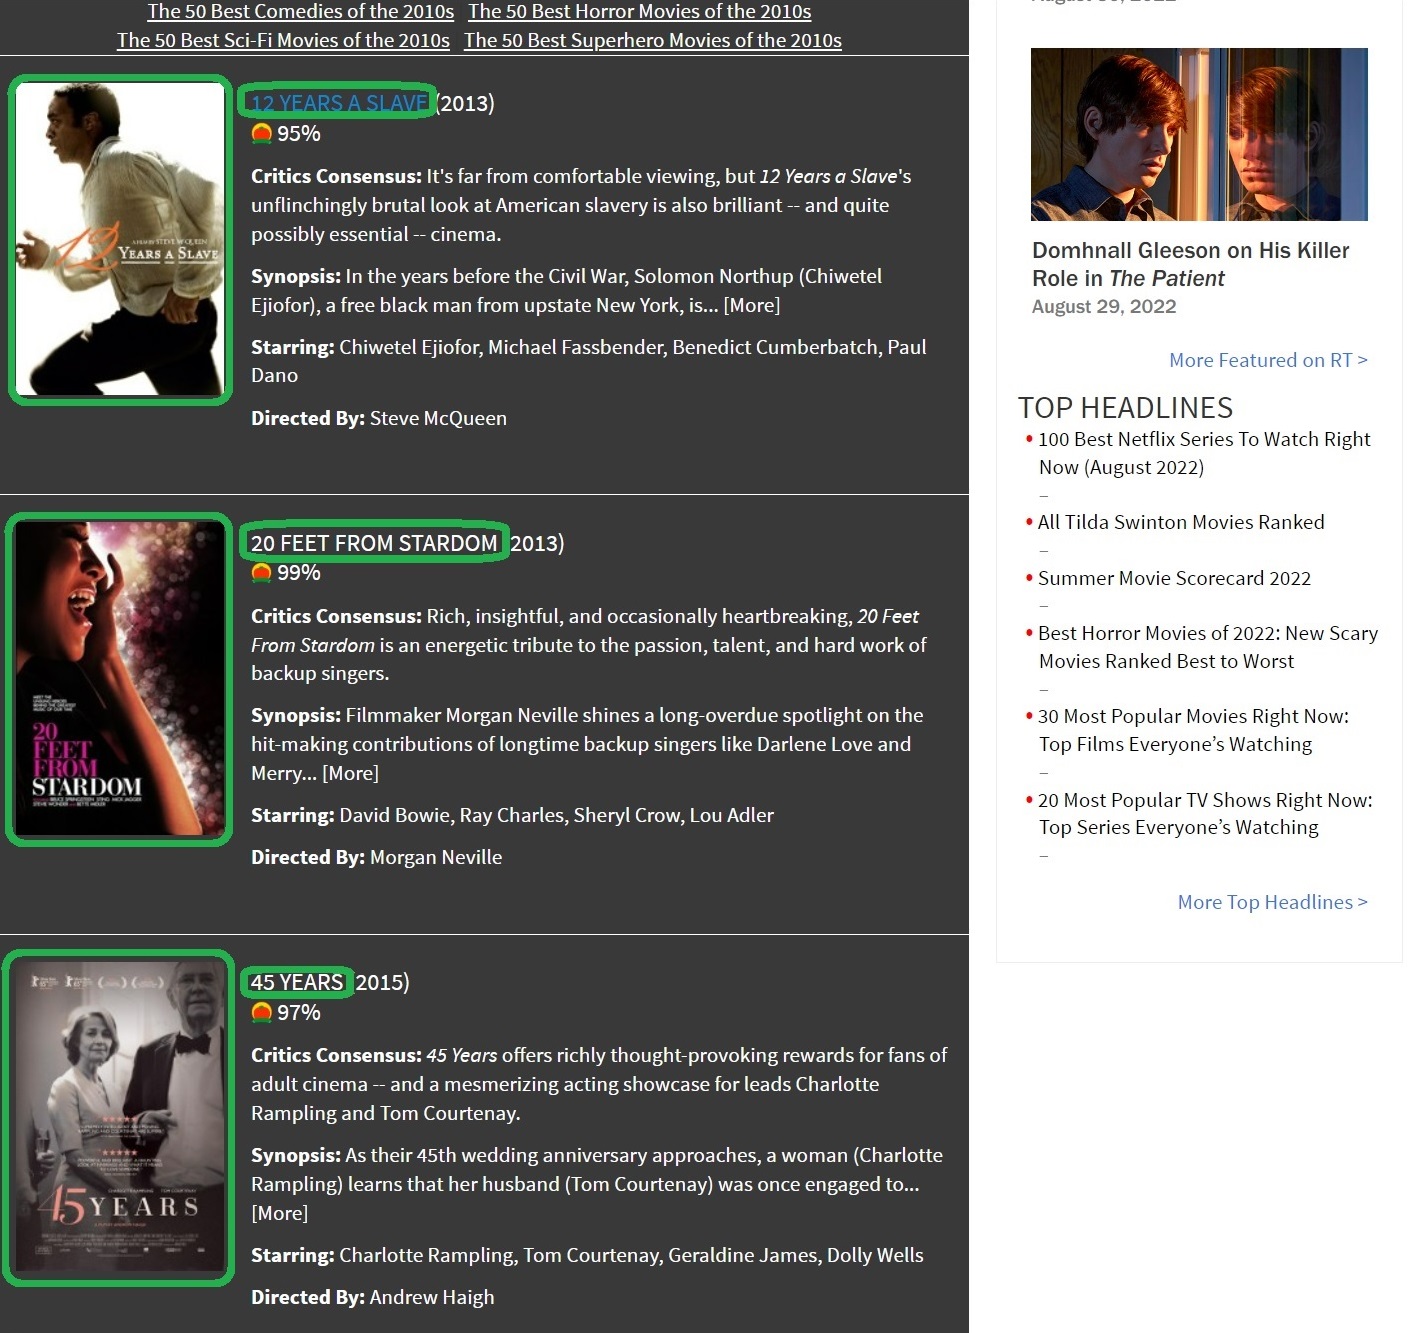
I make use of the SelectorGadget to identify the tags for the relevant nodes. Here is the link for Chrome (recommended).
Extracting urls of movies
The same nodes that contain the text for the titles also contain information on the links to individual movie pages for each title. We can extract this information using the html_attr() function, which extracts attributes.
movie_urls <- main_page %>%
  html_nodes(".article_movie_title a") %>%
  html_attr("href")

movie_urls %>% head()
[1] "https://www.rottentomatoes.com/m/12_years_a_slave"
[2] "https://www.rottentomatoes.com/m/20_feet_from_stardom"
[3] "https://www.rottentomatoes.com/m/45_years"
[4] "https://www.rottentomatoes.com/m/all_is_lost_2013"
[5] "https://www.rottentomatoes.com/m/amazing_grace_2018"
[6] "https://www.rottentomatoes.com/m/american_hustle" Extracting urls of images
image_urls <- main_page %>%
  html_nodes(".article_poster") %>%
  html_attr("src")
Let’s check the image for the 6th title.
knitr::include_graphics(image_urls[6])
2. Scraping data for the first movie on the list
Now I’m going to scrape data for the movie 12 Years a Slave in order to develop the code.
Reading page for the first movie.
url <- "https://www.rottentomatoes.com/m/12_years_a_slave"
movie_page <- read_html(url)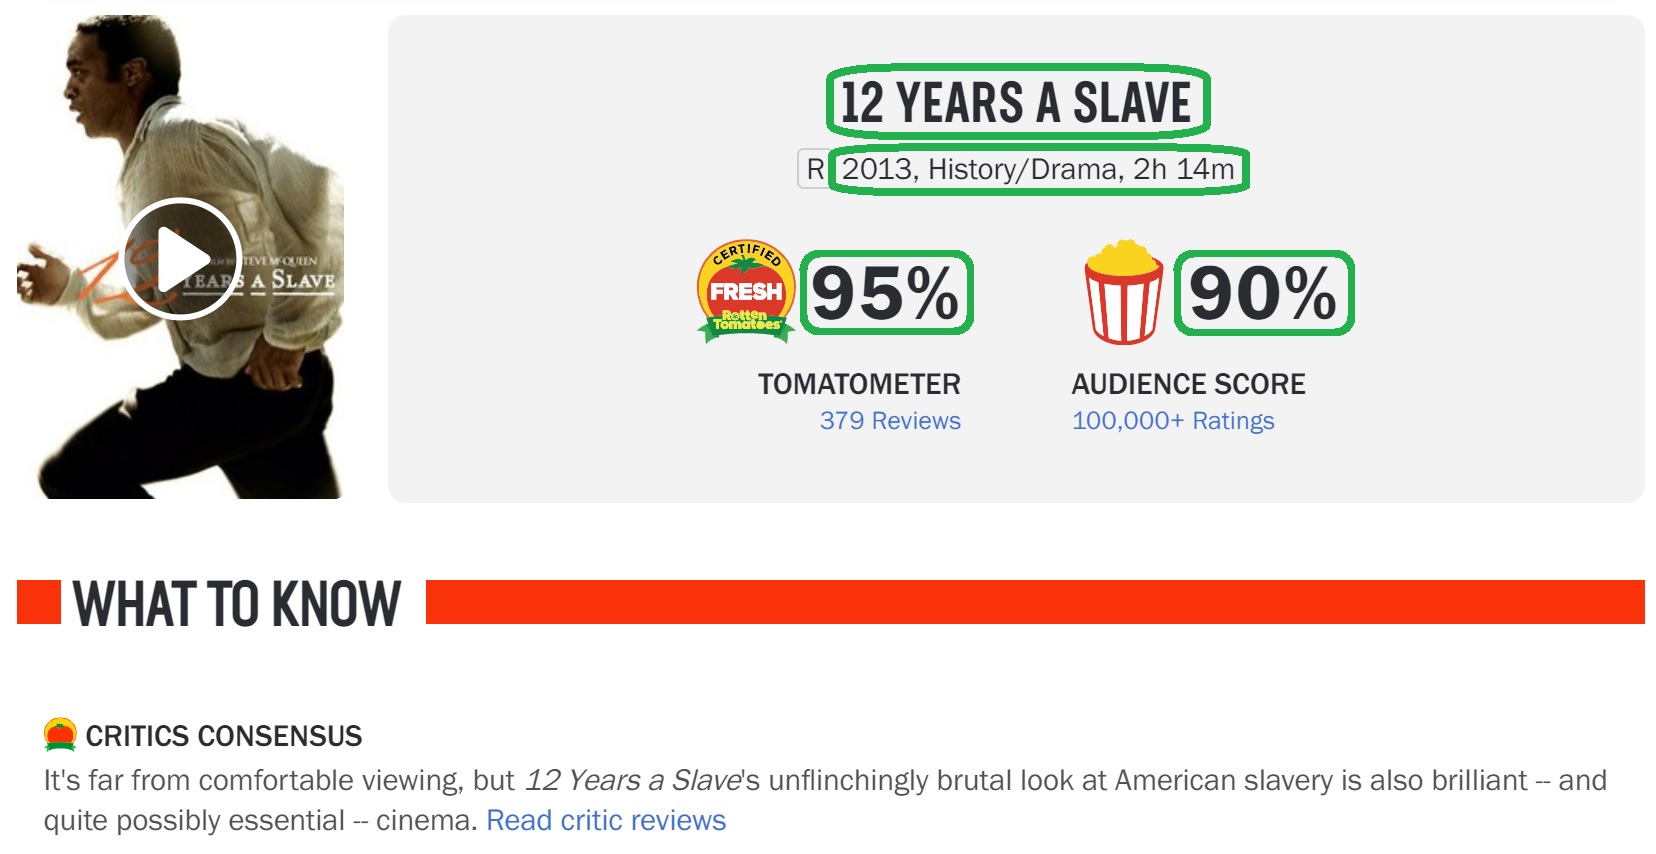
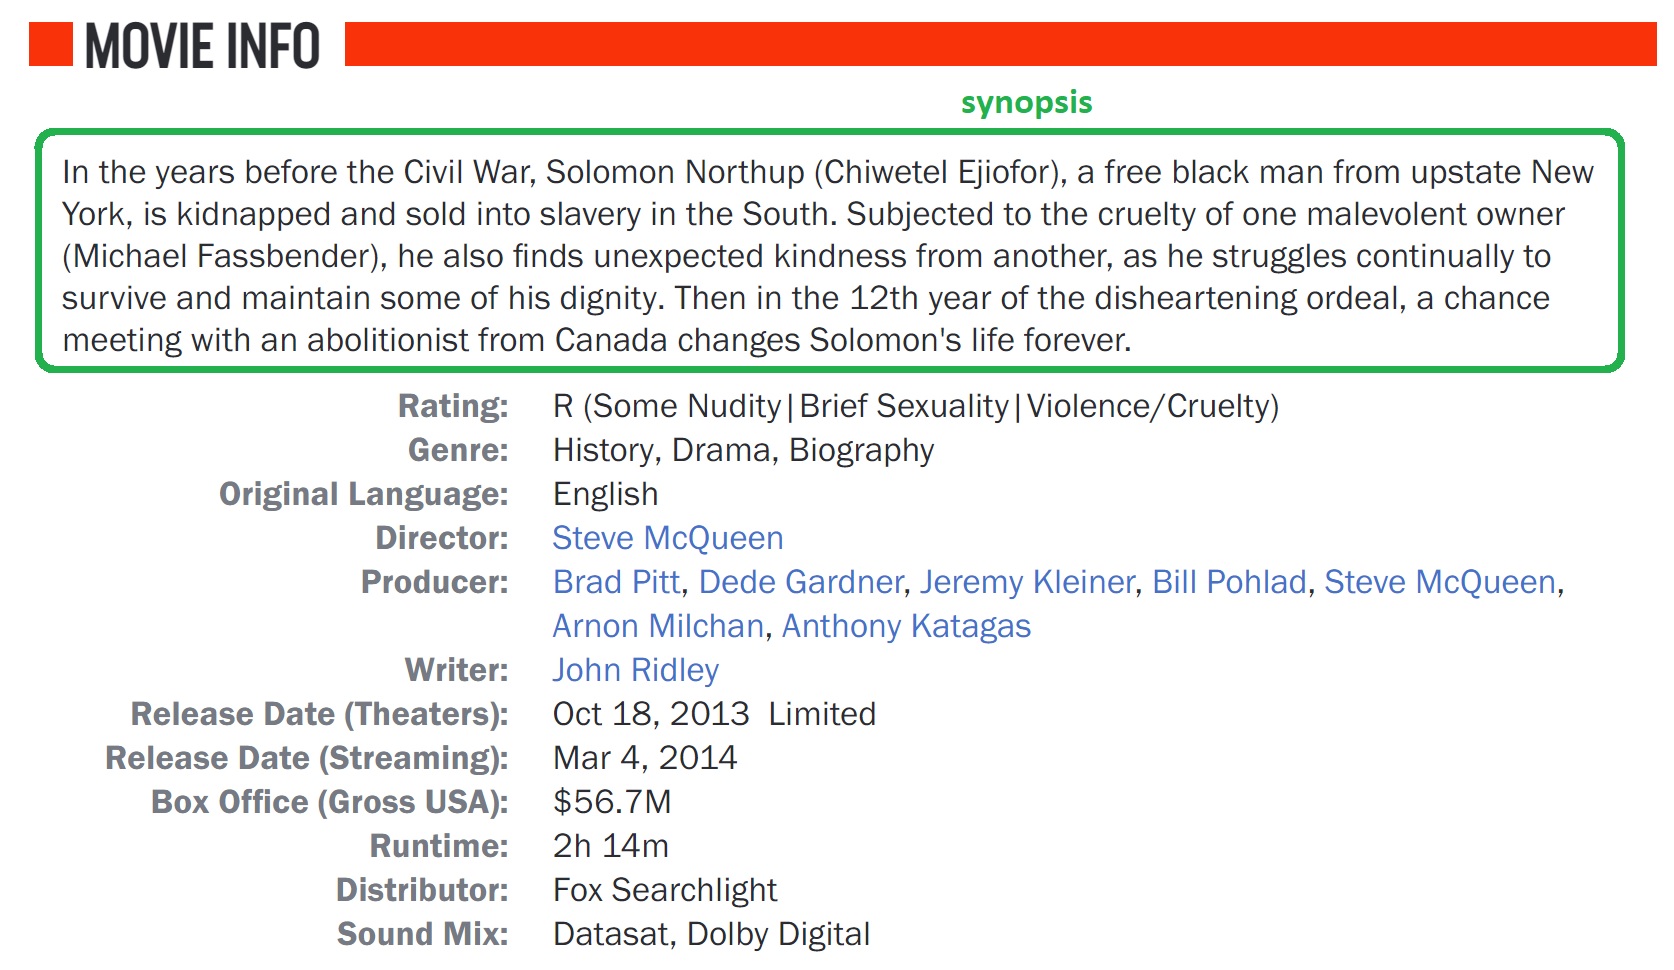
Scroll down the page and you’ll find the movie synopsis.
Extracting title
title <- movie_page %>%
  html_node(".scoreboard__title") %>%
  html_text()

title
[1] "12 Years a Slave"Extracting year, genre, and runtime
year_genre_runtime <- movie_page %>%
  html_node(".scoreboard__info") %>%
  html_text()

year_genre_runtime
[1] "2013, History/Drama, 2h 14m"Extracting critics score
The next two are tricky. I had to look at the page source and find them manually.
critics_score <- movie_page %>%
  html_element("score-board") %>%
  html_attr("tomatometerscore") %>%
  str_c(.,"%")

critics_score
[1] "95%"Extracting audience score
audience_score <- movie_page %>%
  html_element("score-board") %>%
  html_attr("audiencescore") %>%
  str_c(.,"%")

audience_score
[1] "90%"Extracting movie synopsis
synopsis <- movie_page %>%
  html_node("#movieSynopsis") %>%
  html_text2()

synopsis
[1] "In the years before the Civil War, Solomon Northup (Chiwetel Ejiofor), a free black man from upstate New York, is kidnapped and sold into slavery in the South. Subjected to the cruelty of one malevolent owner (Michael Fassbender), he also finds unexpected kindness from another, as he struggles continually to survive and maintain some of his dignity. Then in the 12th year of the disheartening ordeal, a chance meeting with an abolitionist from Canada changes Solomon's life forever."Makinging a data frame of extracted elements
movie  <- tibble(title = title,
                 year_genre_runtime = year_genre_runtime,
                 critics_score = critics_score,
                 audience_score = audience_score,
                 synopsis = synopsis,
                 url = url)

movie %>% glimpse()
Rows: 1
Columns: 6
$ title <chr> "12 Years a Slave"
$ year_genre_runtime <chr> "2013, History/Drama, 2h 14m"
$ critics_score <chr> "95%"
$ audience_score <chr> "90%"
$ synopsis <chr> "In the years before the Civil War, Solomon Northup…
$ url <chr> "https://www.rottentomatoes.com/m/12_years_a_slave"3. Writing a function
Instead of manually scraping individual movies, I’ll write a function to do the same.
scrape_movie <- function(x, ...){

  movie_page <- read_html(x)

  title <- movie_page %>%
    html_node(".scoreboard__title") %>%
    html_text()

  year_genre_runtime <- movie_page %>%
    html_node(".scoreboard__info") %>%
    html_text()

  critics_score <- movie_page %>%
    html_element("score-board") %>%
    html_attr("tomatometerscore") %>%
    str_c(.,"%")

  audience_score <- movie_page %>%
    html_element("score-board") %>%
    html_attr("audiencescore") %>%
    str_c(.,"%")

  synopsis <- movie_page %>%
    html_node("#movieSynopsis") %>%
    html_text2()

  movie_df <- tibble(title = title,
                     year_genre_runtime = year_genre_runtime,
                     critics_score = critics_score,
                     audience_score = audience_score,
                     synopsis = synopsis,
                     url = x)

  return(movie_df)

}
Function in action
Now that we have the scrape_movie() function, let’s scrape data for the movie “American Hustle”.
scrape_movie(movie_urls[6]) %>% glimpse()Rows: 1
Columns: 6
$ title <chr> "American Hustle"
$ year_genre_runtime <chr> "2013, Crime/Drama, 2h 18m"
$ critics_score <chr> "92%"
$ audience_score <chr> "74%"
$ synopsis <chr> "Irving Rosenfeld (Christian Bale) dabbles in forge…
$ url <chr> "https://www.rottentomatoes.com/m/american_hustle"Or “Ex Machina” (an interesting SF movie).
scrape_movie(movie_urls[53]) %>% glimpse()Rows: 1
Columns: 6
$ title <chr> "Ex Machina"
$ year_genre_runtime <chr> "2014, Sci-fi/Mystery & thriller, 1h 47m"
$ critics_score <chr> "92%"
$ audience_score <chr> "86%"
$ synopsis <chr> "Caleb Smith (Domhnall Gleeson) a programmer at a h…
$ url <chr> "https://www.rottentomatoes.com/m/ex_machina"4. Iteration
To make my workflow a little more efficient, I make use of the map_dfr() function from the purrr package to iterate over all movie pages. map_dfr() will apply the scrape_movie()function to each element in the vector of links, and return a data frame created by row-binding. It’s as simple as that.
movies <- map_dfr(movie_urls, scrape_movie)

movies
# A tibble: 200 × 6
title year_genre_runtime criti…¹ audie…² synop…³ url
<chr> <chr> <chr> <chr> <chr> <chr>
1 12 Years a Slave 2013, History/Drama, 2h 1… 95% 90% In the… http…
2 20 Feet From Stardom 2013, Documentary, 1h 30m 99% 82% Filmma… http…
3 45 Years 2015, Drama, 1h 33m 97% 67% As the… http…
4 All Is Lost 2013, Adventure/Mystery &… 94% 64% During… http…
5 Amazing Grace 2018, Documentary/Music, … 99% 80% Singer… http…
6 American Hustle 2013, Crime/Drama, 2h 18m 92% 74% Irving… http…
7 Amy 2015, Documentary/Biograp… 95% 87% Archiv… http…
8 Anomalisa 2015, Comedy/Drama, 1h 30m 91% 71% An ins… http…
9 Ant-Man and The Wasp 2018, Action/Adventure, 1… 87% 80% Scott … http…
10 Apollo 11 2019, Documentary/History… 99% 90% Never-… http…
# … with 190 more rows, and abbreviated variable names ¹critics_score,
# ²audience_score, ³synopsis5. Downloading images
I’ve already extracted urls of images in the first step and saved them to image_urls. Now I’m going to create a directory and directory paths for the images.
fs::dir_create("images/top_200_images/")

paths <- c(str_c("images/top_200_images/", sprintf("%0.3d", 1:200), ".jpg"))

paths %>% head()
[1] "images/top_200_images/001.jpg" "images/top_200_images/002.jpg"
[3] "images/top_200_images/003.jpg" "images/top_200_images/004.jpg"
[5] "images/top_200_images/005.jpg" "images/top_200_images/006.jpg"Since Tableau sorts images alphabetically (1, 11, 111, 2, 22, …) by default, these leading zeros will help Tableau to correctly match the images with the data so I don’t have to do it manually.
Downloading images
This time I’ll use map2() function from the purrr package, It will apply the download.file() function to pairs of elements from two vectors, image_urls and paths.
map2(image_urls, paths, function(.x, .y) download.file(.x, .y, mode="wb")) Are the images properly saved? Let’s read in the image for the first movie.
knitr::include_graphics("images/top_200_images/001.jpg")
6. Data wrangling
Preparing the final dataset for Tableau.
movies <- movies %>%

  # separate year_genre_runtime column into year, genre, and runtime
  separate(year_genre_runtime, sep = ", ", into = c("year", "genre", "runtime")) %>%
  mutate(year = as.factor(year)) %>%

  # separate genre column into primary and secondary genre
  separate(genre, sep = "/", into = c("genre_1", "genre_2"), remove = FALSE) %>%

  # create id column with leading zeroes so Tableau can automatically match the images
  mutate(id = sprintf("%0.3d", 1:200)) %>%
  select(id, everything())

movies %>% head()
# A tibble: 6 × 11
id title year genre genre_1 genre_2 runtime criti…¹ audie…² synop…³ url
<chr> <chr> <fct> <chr> <chr> <chr> <chr> <chr> <chr> <chr> <chr>
1 001 12 Ye… 2013 Hist… History Drama 2h 14m 95% 90% In the… http…
2 002 20 Fe… 2013 Docu… Docume… <NA> 1h 30m 99% 82% Filmma… http…
3 003 45 Ye… 2015 Drama Drama <NA> 1h 33m 97% 67% As the… http…
4 004 All I… 2013 Adve… Advent… Myster… 1h 45m 94% 64% During… http…
5 005 Amazi… 2018 Docu… Docume… Music 1h 27m 99% 80% Singer… http…
6 006 Ameri… 2013 Crim… Crime Drama 2h 18m 92% 74% Irving… http…
# … with abbreviated variable names ¹critics_score, ²audience_score, ³synopsis# number of unique values in genre column
movies$genre %>% unique() %>% length()[1] 59# unique values in genre_1
movies$genre_1 %>% unique() [1] "History" "Documentary" "Drama"
[4] "Adventure" "Crime" "Comedy"
[7] "Action" "Sci-fi" "Romance"
[10] "Horror" "Biography" "Mystery & thriller"
[13] "Kids & family" "War" "Fantasy"
[16] "Musical" "Western" # unique values in genre_2
movies$genre_2 %>% unique() [1] "Drama" NA "Mystery & thriller"
[4] "Music" "Biography" "Adventure"
[7] "History" "Romance" "Comedy"
[10] "Lgbtq+" "Action" "War"
[13] "Fantasy" "Sci-fi" "Crime"
[16] "Musical" "Western" "Anime"
[19] "Horror" Finding values in genre_2, that are not in genre_1. This will help when creating a list parameter for filtering by primary or secondary genre.
setdiff(movies$genre_2, movies$genre_1)[1] NA "Music" "Lgbtq+" "Anime" DT table
If you prefer to search a table for data, then this one is for you!
movies %>%
  select(1:9) %>%
  DT::datatable(rownames = FALSE)
Writing file
I choose to save the data in an excel file only because the csv will remove the leading zeros in the id column.
movies %>% writexl::write_xlsx("datasets/top_200_movies_2010s_rotten_tomatoes.xlsx")7. Tableau dashboard
The final dashboard is created in Tableau. It’s actually a jitter plot, which separates overlapping movies with the same critics’ score.
To avoid two filters, one for primary and one for secondary genre, a list parameter is created that filters movies by primary or secondary genre, or “All” values.
For the best viewing experience, please click on the full screen in the bottom right corner.
You can nteract with the embedded dashboard below or go to Tableau Public. Enjoy!